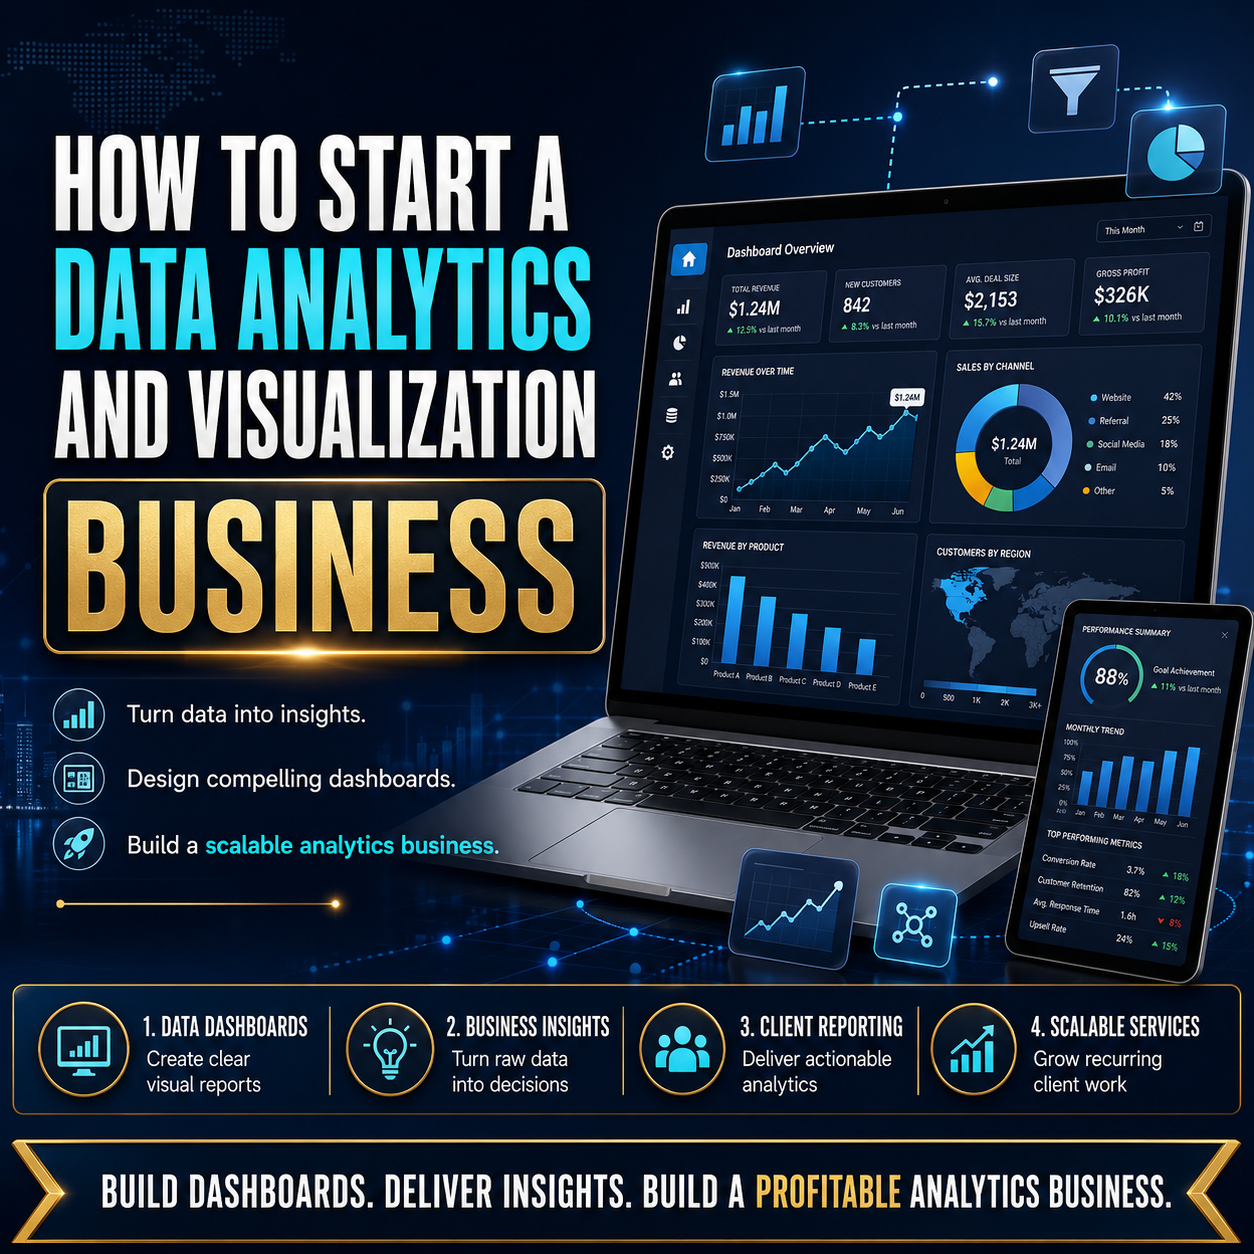
Start a Data Analytics and Visualization Business
Position dashboards as decision support with agreed business measures. Owners and managers needing clear operational insight may need help with data-rich operations where decision-makers still cannot see what matters. This course explores how to turn that need into a focused offer clients can understand, evaluate and buy.
Instead of starting with a generic business plan, examine the specialist decisions that shape this kind of venture: metric definitions, source data, dashboard usability, refresh schedules and stakeholder adoption. Work from a defined customer problem to a practical starter service or product, with realistic delivery boundaries, pricing assumptions and a route to your first market conversations.
What You Will Learn
Focus on the decisions that matter before you launch or expand:
- Choose a target industry and translate management questions into a concise KPI brief.
- Assess the quality, ownership and accessibility of required data sources.
- Plan dashboards around decisions, drill-downs and accessibility rather than visual clutter.
- Scope discovery, build, training and review cycles for a repeatable engagement.
- Price implementation and recurring reporting support without hiding refresh costs.
- Present a sample insight story and build a pipeline of analytics buyers.
See How It Works in a Realistic Business Scenario
Consider a multi-site service business that wants one accurate view of sales, costs and delivery performance. Define the buyer’s desired outcome, the evidence you would need before accepting the work, the smallest credible first engagement and how you would demonstrate progress. Translate the example into a business concept relevant to your skills and local market.
Shape a Sellable First Offer
Use the course concepts to outline a KPI discovery session and a focused dashboard implementation with a target customer, scope, key assumptions, indicative price structure and delivery milestones. Decide which parts can be demonstrated with a small pilot and what should be validated through real customer interviews before committing major time or capital.
Your commercial approach should address metric definitions, source data, dashboard usability, refresh schedules and stakeholder adoption. A beautiful dashboard cannot compensate for inconsistent metrics and poor data quality. Clear boundaries make the service easier to explain, price and deliver responsibly.
Who This Course Is For
Designed for business analysts, Power BI specialists, data visualisation freelancers and aspiring analytics consultants. It is particularly relevant if you already understand the underlying technical field but want a more structured way to package your expertise, assess business viability and communicate value to prospective buyers.
What You Can Work Towards
Develop a concise launch blueprint for a KPI discovery session and a focused dashboard implementation: a defined niche, buyer profile, clear scope, estimated costs, an appropriate pilot or demonstration, a pricing rationale and first outreach steps. Use that blueprint to decide what to validate first and how to present a more credible service to prospective customers.
Take the Next Step
Ready to take your next step? Explore how to position a KPI discovery session and a focused dashboard implementation for owners and managers needing clear operational insight, and develop a more confident, commercially grounded approach to starting your venture.